- Published on
CloudFlare Outage
- Authors

- Name
- Ritu Raj
- @rituraj12797
Cloudflare Outage Breakdown
1. The Incident: What Happened
On November 18, 2025, the internet experienced a significant disruption. Users attempting to access services relying on Cloudflare including major platforms like Spotify and ChatGPT—were met with HTTP 500 (Internal Server Error).
From the outside, the outage appeared chaotic. It wasn't a direct downtime but it was intermittent, basically the server oscillated between giving access and 500 error response then eventually all the requests resulted in 500 Errors.
The following behaviour was observed as per Cloudflare's incident response :-
- The Spike: Error rates would surge globally.
- The Recovery: Minutes later, traffic would seemingly return to normal.
- The Return: The errors would spike again.
DDoS Or A System Failure?
This "flickering" behavior led many to initially suspect a hyper-scale DDoS attack as code bugs usually break things permanently, whereas attack waves often ebb and flow.
Coincidentally Cloudflare's external Status Page(hosted on separate infrastructure) went down at the exact same time. Although this turned out to be a completely unrelated coincidence involving their status page vendor, it created the appearance of a coordinated attack on Cloudflare's infrastructure.
It wasn't until 14:30 UTC that the root cause was identified: not a cyber attack, but a corrupted configuration file inside the Bot Management system.
2 The Flow of Traffic
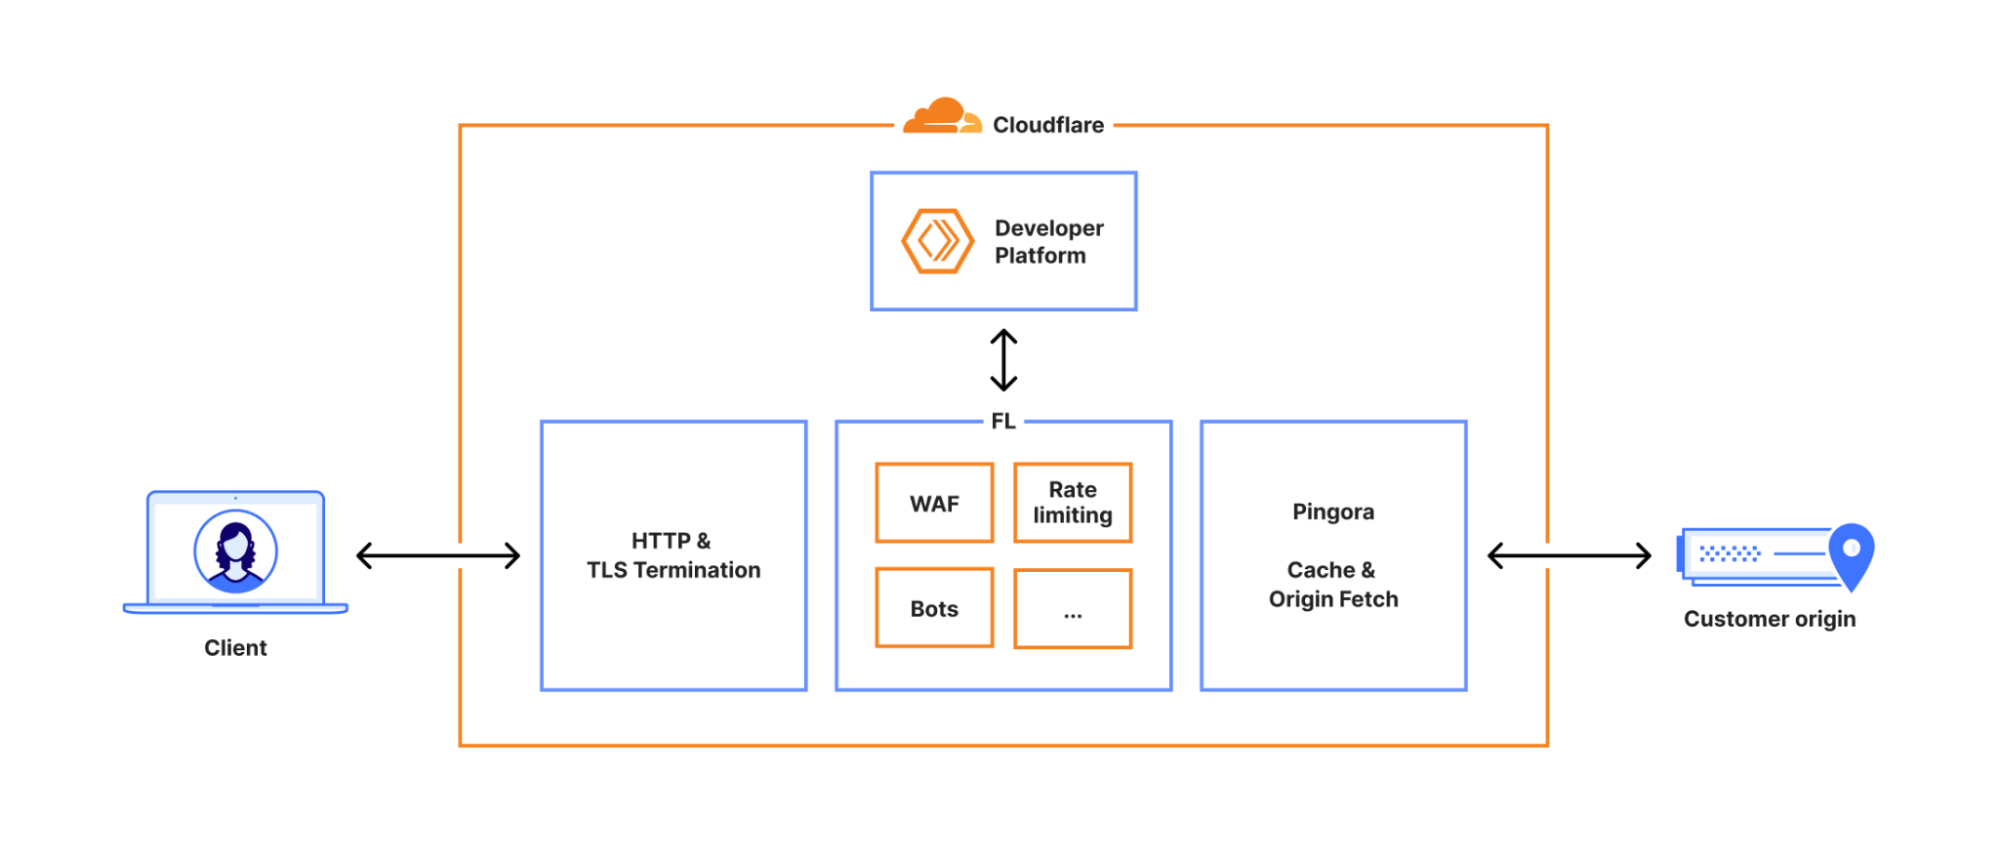
To understand the scope of this outage, we need to look at the "well-defined path" every request takes when it hits Cloudflare’s network.
- The Termination: First, the request hits the HTTP and TLS layer. This handles the initial handshake and decryption.
- The Core Proxy ("Frontline"): The request moves into the core proxy system, internally known as Frontline (FL). This is where logic such as security policies, WAF rules, and routing decisions are applied.
- The Origin Fetch: Finally, it passes through Pingora, which handles cache lookups or fetches data from the customer's origin server if needed.
The Bot Management Module
The failure occurred inside the Frontline (FL) layer.
Within FL, there are various modules that inspect traffic. One of the most critical is Bot Management. Its job is to calculate a "Bot Score" for every request to determine if the visitor is a human or a script. For a bot request, this score is 0; for a genuine human request, the score is 100.
To do this, it uses a Machine Learning model. This model requires specific inputs—called Features—to assess the request.
The "Feature File"
The list of which features the model should check is not hardcoded. It is dynamic because security vulnerabilities and attack patterns keep evolving. This Feature File was the primary catalyst for the outage.
Crucially, the system has a strict limit on the size of this Feature File. Anything larger than this limit triggers a system-wide panic (a complete crash).
What happened during the incident was that an update in the database permission system caused the Feature File to generate with duplicate entries. This duplication effectively doubled the file size, pushing it over the hard limit and causing the FL systems to panic and fail.
- The Config: The system relies on the Feature File, a configuration list used by the ML model.
- The Update Cycle: Because threats change rapidly, this file is regenerated and pushed to the global network every few minutes (every 5 minutes at Cloudflare).
- The Source: The file is generated by running a query against Cloudflare’s analytics database cluster (ClickHouse).
Scoring Of A Request
Based on the Feature file and the request parameters a score is asigned to the incoming request between 0 and 100, this score is compared against a threshold to decide whether to pass this request or not.
3. Prerequisites Before Diving Deep.
Before going into the technical trenches of how the chaos unfolded, we wil look into some fundamental concepts involved in this incident.
3.1 Distributed Databases And Sharding
When the data to be stored is humongous, databases go for horizontal scaling; this method is known as sharding.
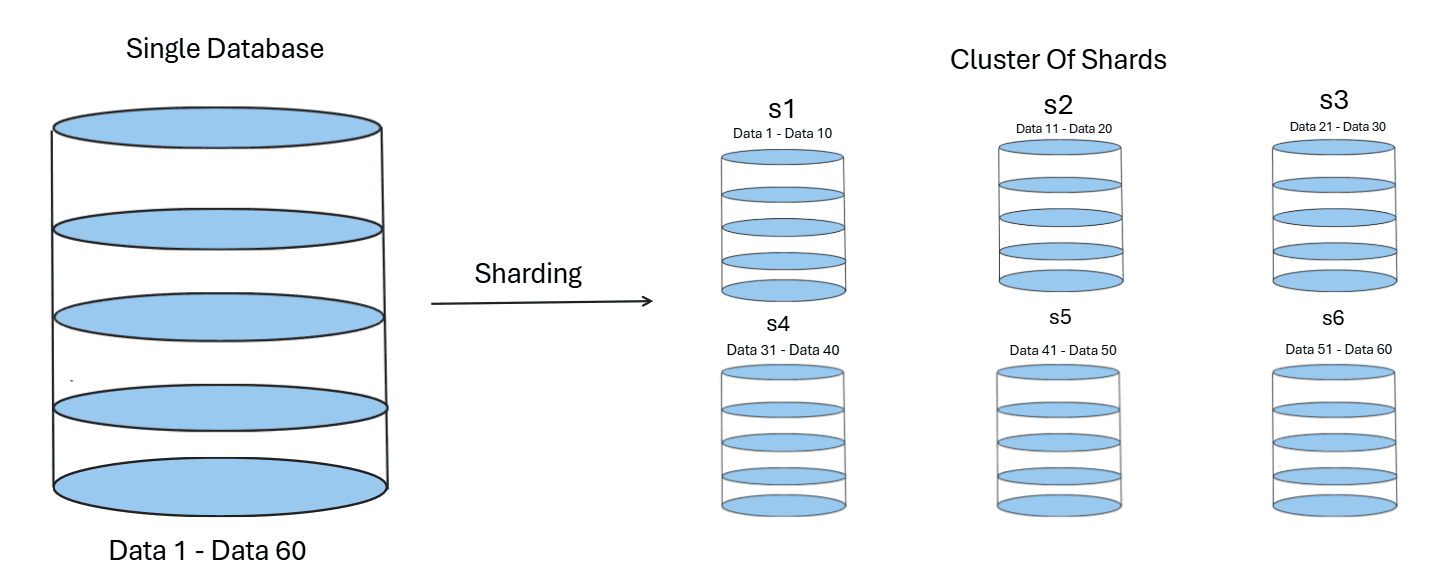
Basically, instead of creating very large storage on a single machine or server, a cluster is established consisting of multiple smaller servers. Each of these stores a part of the data. These smaller units are called shards, and this breaking of a large database into a cluster of nodes is known as sharding.
The benefits include:-
- Increased Availability: If one node fails, the others remain active.
- Reduced Complete Shutdowns: System-wide failures become less likely.
- Increased Capacity: Traffic is distributed among multiple nodes rather than a single computer handling all of it.
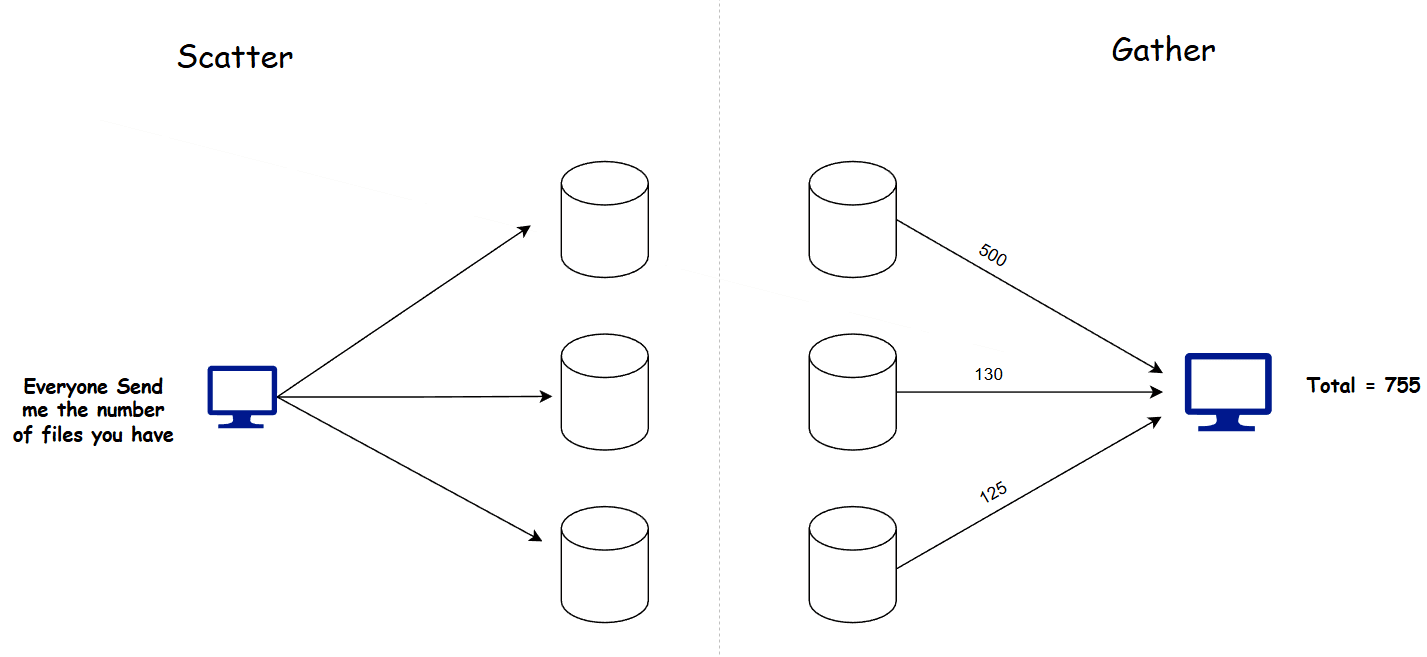
3.2 Scatter Gather Pattern
This is a common design pattern which is used in distributed systems where data needs to be fetched from multiple servers at once and aggregated.
How does this work?
- The client sends a request for data retrieval to a server.
- An internal mechanism directs this request to a Coordinator node (or server).
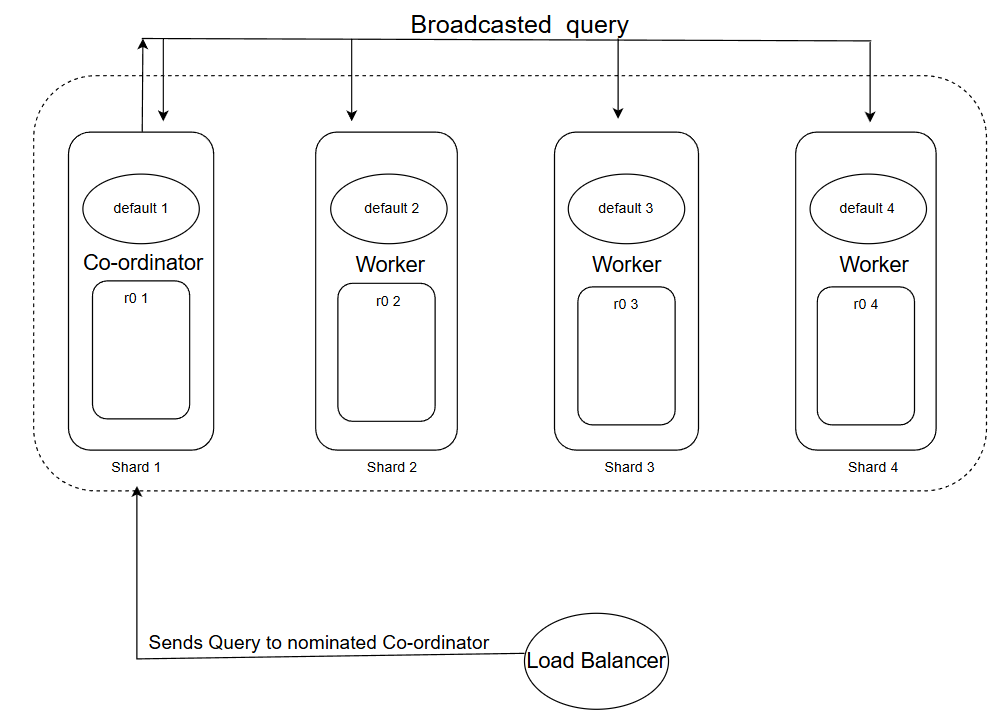
- The Coordinator broadcasts a request to all available nodes (shards) to fetch data from their local storage. This step is the Scatter phase.
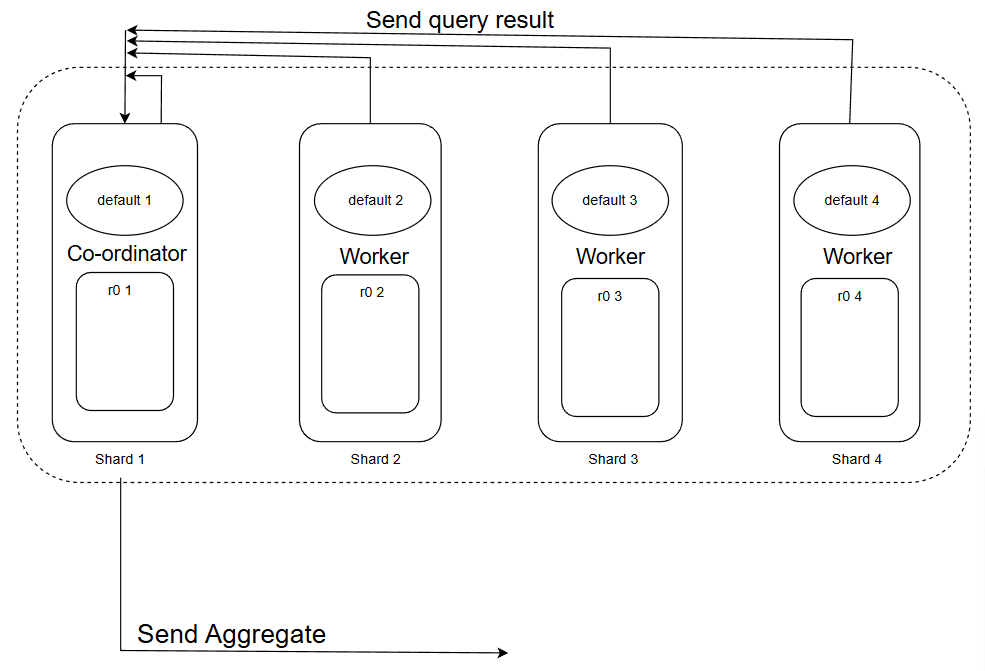
- Next, the worker nodes respond to this request individually and send their results back to the Coordinator.
- The Coordinator gathers the responses from each node and aggregates the data.
- Finally, this aggregated data is sent back to the client.
The benefit of this pattern is that you don't need to store the data in one place. Instead, you communicate with all the nodes to retrieve the data. This mechanism is widely used in sharded database clusters for executing queries for example, ClickHouse utilizes this approach.
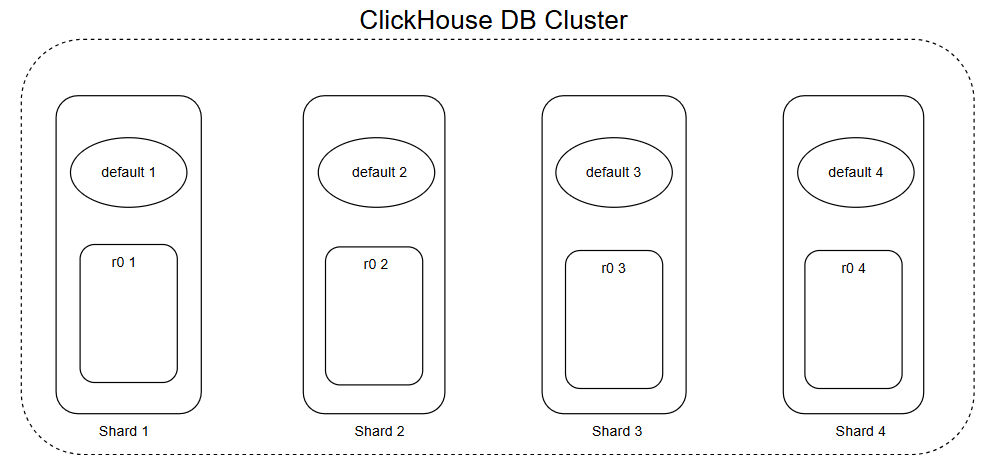
3.3 The Click House DB Cluster Architecture
Cloudflare uses a ClickHouse Analytics database for data storage and generation of feature files for its model, this database is distributed in nature and consisted of shards which together form a cluster.
Interesting part is the internal structure of these shards, internally each of these shards have 2 main components which are :-
- Default Table :- This table behaves like a map(but is not actually a map we will see why later...), it maps the location from where the data could be fetched from (we will see how...).
- r0 Table : This is the actual storage unit which stores the data inside it.
Enough of technical jargon we will look into the why's and how's of this system
Default Table
Consider this as the communicator for each shard, it enables shards to communicate with fellow shards in both way :-
- Co-ordinator : A shard is communicator when it uses default as a broadcaster to send the query to all other shards to look if they contain the required data from query and aggregate the data and revert it back.
- Listener/Worker node :- It can receive query to locate the data from the r0 table of it's shard and return the response to the cordinator.
The Default works by receiving a query to find all the r0 tables in the cluster which contains the data, but it does not store them in it (that's why its not a map), it simply performs a scatter gather workflow and then returns the result, this way it saves memory by actually storing nothing but working in the expected manner. This is why it only behaves like a map but is not actually one.
r0 Table
This is the main data storage unit which is a database engine based on, when we fetch the data we fetch from this.
Query Execution
Now we will look how a query actually gets executed on this architecture, but first let look at a illustrative example of who the architecture looks like :-
An exemplary scenario to visualize how the system works under a real-time scenario:
Sequence of operations:
- The client sends this
SELECT * FROM system.tablequery to the cluster. - The load balancer nominates a node as a coordinator and forwards this request to this node.
- The coordinator transforms this query to something like
SELECT * FROM r0.table(to target the local storage) and then broadcasts this. - IMP: Now all the nodes other than the coordinator are in worker mode already. A situation may arise where the coordinator's own
r0table contains the data, and we might miss that one. - So, the coordinator also works on this query to find the data in its own
r0table too. - All the other shards return their results. With all the responses in place, the coordinator aggregates the results and sends them back to the client via a proxy.
This can be visualized in a 2 phase process :-
Phase 1
Phase 2
4. What Happened Exactly
To understand why the system broke, we must look at how Cloudflare’s internal tools talk to their database cluster.
Until now, the automated scripts that generate the Feature File operated under a specific security model. This model relied on a concept called Implicit Access.
The Old Way: Implicit Access
In the legacy setup, when the script wanted to query the database:
- The Target: It connected to the Manager (
default). - The Identity: It ran under a shared "System Account" (similar to a Super Admin or root user).
- The Work Under the Hood: The script’s specific user account did not have permission to see the Storage (
r0) tables. It didn't need to. Because it was using the System Account, the Manager would quietly fetch data from the Workers behind the scenes. This meant the user had access to ther0tables only indirectly, which is why it is said to be "implicit."
If the script asked "What tables can I see?", the database would check the user's permissions and reply: "You can only see the Manager (default). The Storage tables are hidden from you."
The New Way: Explicit Access
To improve security and accountability, engineers began rolling out a change. They wanted to stop using the shared System Account and instead use Fine-Grained Access Control.
- The Change: They granted the specific user account Explicit Permission to access the Storage (
r0) tables directly. - The Goal: Accountability. If a heavy query crashed a shard, the logs would identify the specific user responsible, rather than just blaming the generic "System Admin."
This is a standard best practice in reliable engineering. However, it had a side effect that went unnoticed during testing.
The Visibility Shift
By granting explicit access to the storage layer, the Storage (r0) was no longer hidden.
- Before the change: The user’s view of the database contained 1 table (The Manager default table).
- After the change: The user’s view of the database contained 2 tables (The Manager default table AND The Storage).
This change in visibility was the spark. The fuel was the specific SQL query used to read that view, which we will examine in the next section.
5. The Root Cause: When Metadata Sees Double
To understand exactly why the file size exploded, we need to look at the specific mechanism Cloudflare uses to generate the Feature File.
The Bot Management system uses an automated script to verify which features are available in the database before adding them to the configuration. It does this by querying the System Catalog.
The System Catalog (system.columns)
ClickHouse has a built-in database called system. This is not where user traffic data lives; it is the Metadata layer. It describes the structure of the database itself.
Specifically, the table system.columns is a list of every column in every table that the user is currently allowed to see.
The Fatal Query
The script used to generate the Feature File ran a SQL query effectively like this:
SELECT name, type
FROM system.columns
WHERE table = 'http_requests_features'
ORDER BY name;
The Logic Error: The query filters by Table Name, but it does not filter by Database Name, as it originally assumed that only default tables will be visible so no checking was performed here.
The "Double Vision" Effect
This is where the architecture and the permissions change collided.
Before the Update: The user only had permissions to see the Manager (default). The Storage (r0) was invisible.
- Query Result:
feature_A(found indefault). - Total: 1 definition per feature.
After the Update: The user was granted explicit permission to view the Storage (r0). Now, the system.columns catalog dutifully reported everything the user could see. Since the Manager must be a structural mirror of the Storage to function, they have identical columns.
- Query Result:
feature_A(found indefault)feature_A(found inr0) <-- THE DUPLICATE
- Total: 2 definitions per feature.
The script blindly ingested this list. It assumed that if the database listed a column, it was a unique feature. It did not deduplicate the results. Consequently, a list of ~60 features instantly became a list of ~120+ features.
6. Why Oscillatory Behavior Of 5XX Errors?
One of the most confusing aspects of the incident was the graph of 500 errors. It didn't shoot up and stay up; it oscillated.
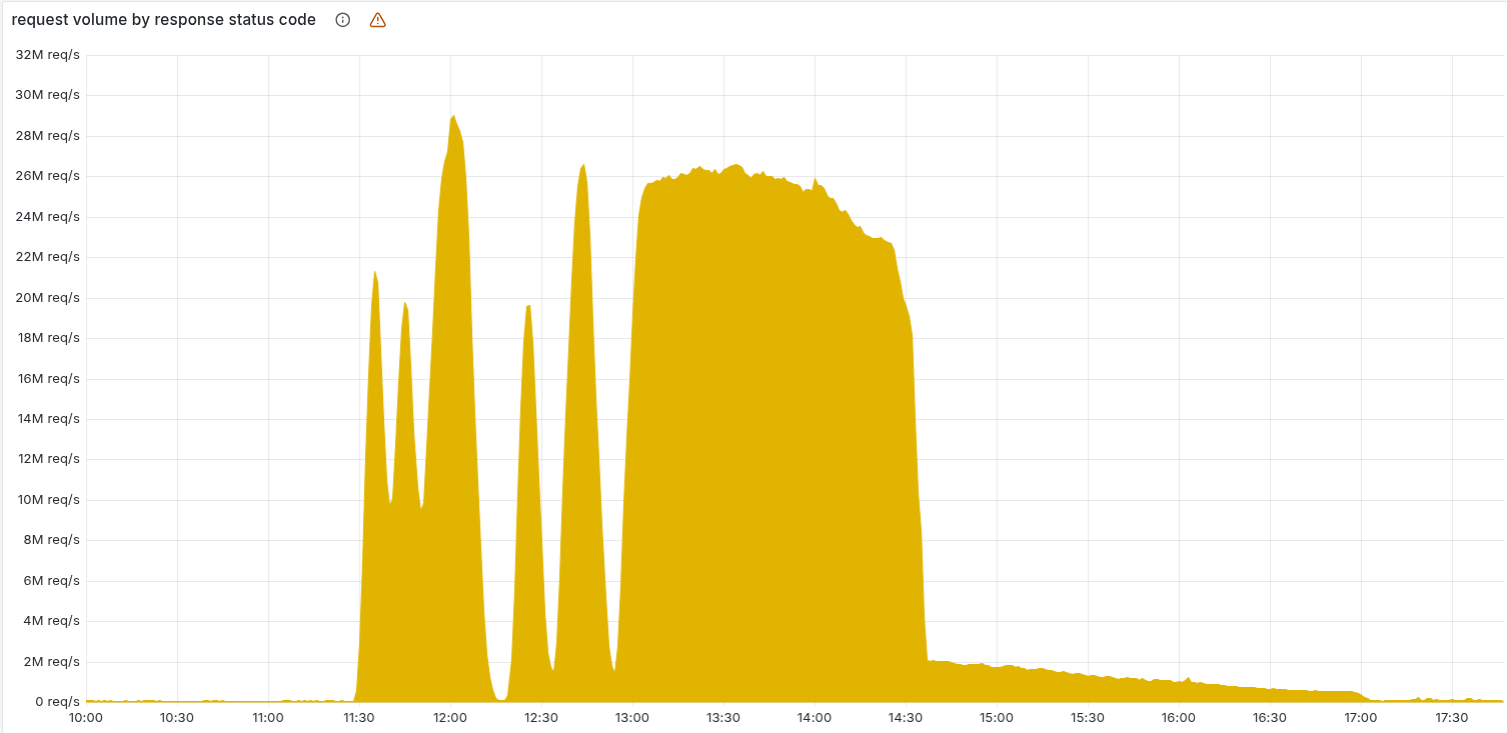
This "flickering" behavior is explained by the interaction between the Load Balancer and the Gradual Rollout of the database update.
- The Rotation Wheel: The automation script runs every 5 minutes. Each time it runs, the Load Balancer randomly selects one ClickHouse node to act as the Coordinator for that specific query.
- The Mix: Because the permission update was being rolled out gradually, the cluster contained a mix of "Updated Nodes" (Bad) and "Legacy Nodes" (Good).
The Mechanism of Oscillation:
- Crash: When the Load Balancer selected an Updated Node as the Coordinator, the query returned duplicates. The Feature File size doubled, causing the Bot Management system to panic.
- Recovery: Five minutes later, if the Load Balancer selected a Legacy Node, the query returned clean data. The system generated a valid file, and traffic recovered.
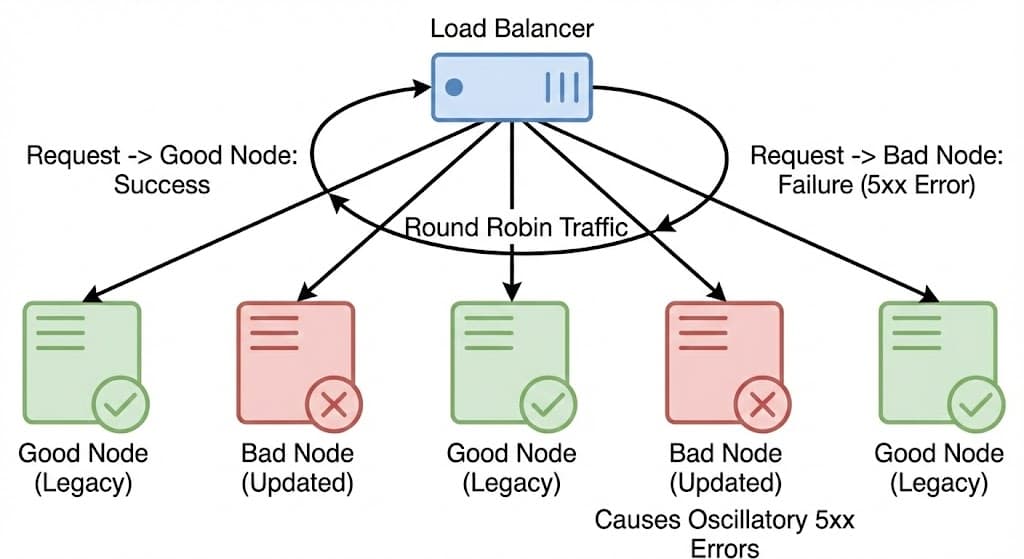
The Saturation: As time passed, the update propagated to more and more nodes. The probability of hitting a "Good Node" dropped to zero. Eventually, every node in the cluster was updated, and the graph transitioned from an oscillatory pattern to a complete saturation of 500 errors.
7. The Crash
The database returned a list of columns that was massive. It wasn't just a simple doubling of the 60 features; the explicit access to r0 meant the query pulled in additional metadata and duplicate entries that were previously hidden.
The Hard Limit
To ensure the proxy runs at lightning speed, Cloudflare uses Memory Preallocation. Instead of asking the OS for memory dynamically (which is slow), they allocate a fixed chunk of memory at startup.
- The Limit: The system was hard-coded to support a maximum of 200 features.
- The Reality: The new, corrupted file contained more than 200 entries, breaching this safety ceiling.
The Fatal Code: unwrap()
When the corrupted Feature File arrived, the Rust code tried to load it. The count exceeded 200, so the function returned an Error result.
In robust software, when you hit a configuration error, you handle it gracefully (e.g., "Log a warning, discard the new file, and keep using the last good one").
However, the specific line of Rust code responsible for loading this configuration looked something like this:
setup_features(features).unwrap();
In Rust, the .unwrap() function is a strict instruction: "I am certain this will succeed. If it returns an Error, do not handle it, just panic and crash the thread immediately."
The Loop of Death
- Load: The proxy tried to load the oversized file (>200 items).
- Panic: The limit check failed, returning an Error. The
unwrap()saw the Error and panicked, crashing the worker thread. - 5xx: The request that was being processed failed with an Internal Server Error.
- Restart: The system automatically restarted the thread to recover.
- Repeat: The restarted thread immediately tried to load the same bad file, crashing again.
This created a restart loop that consumed massive amounts of CPU and resulted in the 5xx errors users saw globally.
8. Recovery and Lessons
The outage didn't end instantly. It took hours to fully stabilize because the bad file had to be scrubbed from the global network.
The Fix
Once the engineering team identified that the Feature File was the culprit, the recovery process was manual and blunt:
- Stop the Bleeding: They disabled the automated ClickHouse query that was generating the corrupted file.
- Restore History: They retrieved a known "Good" version of the file from before the database update.
- Manual Push: They manually injected this good file into the distribution system.
- Force Restart: They forced the proxy services to restart, breaking the panic loop and allowing them to load the clean configuration.
My Views And Lessons From This
A robust system should behave like a Circuit Breaker. It should protect the system from bad updates by automatically decoupling the failing component.
In the context of configuration updates, the flow should look like this:
Detection: When the new Feature File arrives, the system attempts to validate it (checking if size > 200).
The Trip (Fallback): If the validation fails or the code panics during loading, the Circuit Breaker "trips." Instead of crashing the whole application, the system automatically switches to the older, working version (the Last Known Good Configuration).
Stabilization: The system continues to serve traffic using the old configuration. The bad update is rejected, and an alert is sent to the engineering team.
Recovery: Only when the underlying issue is resolved does the system close the circuit. It can then begin a gradual rollout, slowly routing traffic to the updated configuration to ensure stability before fully committing.
If this pattern had been in place, the database update would have triggered a few warning logs, but the global internet traffic would have continued flowing without interruption using the previous hour's configuration.